


Introduction
Microsoft Excel is one of the most powerful tools for data analysis. Whether you’re a beginner or an advanced user, Excel provides numerous functions, formulas, and tools to help you process, visualize, and interpret data. Businesses, analysts, and researchers rely on Excel to manage large datasets, spot trends, and make data-driven decisions.
In this guide, we’ll walk you through the essential steps to analyze data in Excel, covering everything from data cleaning to advanced analysis techniques.
1. Getting Started with Excel for Data Analysis

Before diving into analysis, it’s important to ensure your dataset is well-structured and formatted correctly. Follow these steps:
1.1 Open and Import Data
- If your data is in a CSV, text, or other format, open Excel and navigate to File > Open to load it.
- For external data sources (SQL, web data, etc.), use Data > Get Data.
1.2 Organizing Data in Excel
- Ensure column headers are clear and meaningful.
- Remove unnecessary blank rows and columns.
- Apply filters (Data > Filter) to sort and view specific data points.
1.3 Formatting Data as a Table
Excel tables make managing data easier by allowing automatic filtering, sorting, and formula applications.
- Select your dataset, then go to Insert > Table.
- Check “My table has headers”, then click OK.
2. Cleaning and Preparing Data in Excel

Messy or inconsistent data can lead to inaccurate analysis. Before running any calculations, follow these steps to clean your data.
2.1 Removing Duplicates
- Select your dataset.
- Go to Data > Remove Duplicates and choose the columns to check.
2.2 Handling Missing Data
- Use IFERROR() or IFNA() to replace missing values.
- To fill blanks with averages, use =AVERAGE(range).
- Use Go To Special (Ctrl + G > Special > Blanks) to find empty cells quickly.
2.3 Standardizing Data
- Convert text to proper case using =PROPER(A1).
- Remove extra spaces with =TRIM(A1).
- Convert numbers stored as text with =VALUE(A1).
3. Essential Excel Functions for Data Analysis
Excel offers a variety of functions that help analyze and summarize data efficiently.
3.1 SUM, AVERAGE, COUNT Functions
- SUM(): Adds up values in a range → =SUM(A1:A10)
- AVERAGE(): Finds the mean → =AVERAGE(A1:A10)
- COUNT(): Counts numerical values → =COUNT(A1:A10)
3.2 IF and Nested IF for Conditional Analysis
- The IF function helps apply conditions to data → =IF(A2>100, “High”, “Low”)
Use Nested IF for multiple conditions:
excel
Copy
=IF(A2>100, “High”, IF(A2>50, “Medium”, “Low”))
3.3 VLOOKUP and HLOOKUP for Finding Data
- VLOOKUP(): Finds data in a vertical column → =VLOOKUP(lookup_value, table_range, col_index, FALSE)
- HLOOKUP(): Finds data in a horizontal row → =HLOOKUP(lookup_value, table_range, row_index, FALSE)
3.4 INDEX-MATCH for Advanced Lookup
Unlike VLOOKUP, INDEX-MATCH allows for more flexible searches:
excel
Copy
=INDEX(B2:B10, MATCH(lookup_value, A2:A10, 0))
3.5 TEXT Functions for Data Formatting
- Extract year from a date: =YEAR(A1)
- Combine text: =CONCATENATE(A1, ” “, A2)
- Convert text case: =UPPER(A1), =LOWER(A1)
4. Using Pivot Tables for Data Analysis
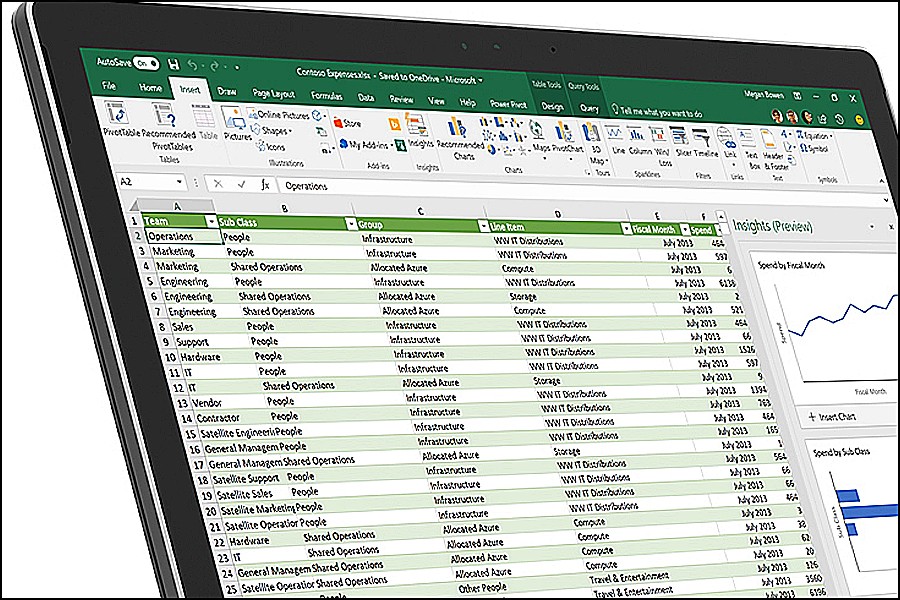
Pivot Tables are a powerful tool to summarize and analyze large datasets quickly.
4.1 Creating a Pivot Table
- Select your dataset.
- Go to Insert > PivotTable.
- Choose where to place the PivotTable (New or Existing Worksheet).
- Click OK.
4.2 Configuring the Pivot Table
- Drag fields into Rows (categorical data like product names).
- Drag numerical data into Values (sales, revenue).
- Drag fields into Columns to compare categories.
4.3 Applying Pivot Table Filters and Sorting
- Use the Filter option to refine results.
- Click on any column and sort in ascending or descending order.
5. Data Visualization with Excel Charts
Charts help transform raw data into meaningful insights.
5.1 Creating a Chart
- Select data.
- Go to Insert > Charts and choose from:
- Bar Chart (Comparisons)
- Pie Chart (Proportions)
- Line Chart (Trends over time)
- Scatter Plot (Relationships between variables)
5.2 Customizing Charts
- Click on the chart to modify titles, labels, colors, and styles.
- Use Chart Tools > Format to adjust the design.
6. Advanced Data Analysis Techniques in Excel

6.1 Conditional Formatting
- Highlight important data using Home > Conditional Formatting.
- Example: Highlight cells where sales exceed $10,000.
6.2 Goal Seek & What-If Analysis
- Use Data > What-If Analysis > Goal Seek to find input values that achieve a target output.
- Example: Determine required sales to hit a revenue goal.
6.3 Using Excel Solver for Optimization
- Go to Data > Solver.
- Define an objective (maximize profit, minimize cost).
- Set constraints and click “Solve”.
7. Exporting and Sharing Your Data Analysis

7.1 Saving and Sharing Reports
- Save as .xlsx for full functionality.
- Save as PDF for easy sharing (File > Save As > PDF).
7.2 Automating Reports with Macros
- Use View > Macros > Record Macro to automate repetitive tasks.
Conclusion
Excel is a versatile tool that enables users to clean, analyze, and visualize data effectively. Whether you’re performing simple calculations or advanced analytics, Excel provides the necessary tools to make data-driven decisions. By mastering functions, PivotTables, and visualization techniques, you can significantly enhance your data analysis skills.
Would you like to dive deeper into specific Excel functions? Let us know in the comments!
FAQs
Start by cleaning and organizing data, then use formulas, PivotTables, and charts for analysis. Advanced users can utilize Goal Seek, Solver, and Conditional Formatting for deeper insights.
PivotTables are among the most powerful tools for summarizing and analyzing data, while VLOOKUP, INDEX-MATCH, and IF functions are essential for conditional and lookup-based analysis.
Use bar charts, pie charts, and line graphs via Insert > Charts. Conditional formatting also helps highlight trends in raw data.
Yes, using Macros and Power Query, you can automate repetitive tasks and data transformations.
Excel handles datasets well but has limitations with extremely large data (over 1 million rows). In such cases, Power BI or SQL-based tools may be better.